【正文】中国的建设项目帮到贫困国家的经济了吗? [美国媒体]
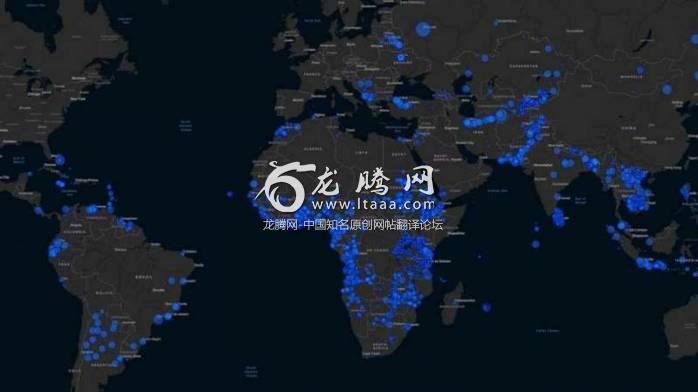
地图上的圆圈精确定位了数千个中国提供资金的开发项目的位置。圆圈越大,就表示投资额越大。最大的圆圈代表了规模达到数十亿美元的项目。
China's building spree in poor nations: Does it really help the local economy?
中国的建设项目帮到贫困国家的经济了吗?
The circles on the map pinpoint the location of thousands of Chinese-funded development projects. The bigger the circle, the bigger the investment. The largest circles represent projects in the multibillion-dollar range.
地图上的圆圈精确定位了数千个中国提供资金的开发项目的位置。圆圈越大,就表示投资额越大。最大的圆圈代表了规模达到数十亿美元的项目。
China has done a ton of building in the developing world.
中国已经在发展中国家完成了大量的建设工作。
That shroud of secrecy has bolstered a popular narrative that China is a "rogue donor" that pours money into undemocratic governments to promote Chinese growth and access to natural resources. Skeptics say the Chinese projects are of little use to the countries, often in Africa, where they're built. Politicians have described some of them as "white elephant" projects. They point to seaports, bridges and other projects that cost a great deal to build but aren't actually getting a lot of use.
这层神秘的面纱支持了一种流行的说法,即中国是一个“流氓捐助国”,它通过向不民主的政府提供资金来促进中国的增长和获取自然资源的渠道。持怀疑态度的人说,中国的项目对建设这些项目的国家来说没有什么用处,而这些国家通常位于非洲。政客们将其中一些项目形容为“白象”项目。他们指出,海港、桥梁和其他项目的建设成本很高,但它们实际上并没有得到大量使用。
It also doesn't help that there have been numerous accounts of shoddy construction: A road in Zambia washed away during the 2009 rainy season. A bridge in Kenya collapsed during construction in 2017. And a hospital in Angola was evacuated months after opening in 2010 for fear it would collapse.
还有很多关于劣质建筑项目的报道:赞比亚的一条公路在2009年雨季被冲毁;肯尼亚一座桥梁在2017年建造过程中倒塌;安哥拉一家医院在2010年开业几个月后因担心其倒塌而被清空。
The AidData team came to that conclusion after identifying and locating more than 4,400 Chinese development projects implemented in 138 countries between 2000 and 2014. They did so using online sources, like news articles, Chinese embassy websites and field research from academics and nongovernmental organizations.
“援助数据”团队在确定和定位了2000年至2014年期间在138个国家实施的4400多个中国发展项目后得出了上述结论。他们利用网络资源——如新闻报道、中国大使馆网站以及学术界和非政府组织的实地调查——得出了这一结果。
"The Chinese government doesn't have a central data set that they share," Parks says. "But there's a huge amount of information that is scattered across the Web."
帕克斯说:“中国政府没有能够共享的中央数据集,但有大量的信息分散在互联网上。”
Then they looked at nighttime satellite images from the U.S. Defense Meteorological Satellite Program's Operational Linescan System satellites. Parks says that it's "reasonably well-established in [academic] literature" that nighttime light is a good indicator of household income – more light means that families in that area have more money.
然后,他们查看了美国防卫气象卫星计划线性扫描系统卫星的夜间卫星图像。帕克斯指出:“在学术文献中有相当充分的证据表明”夜间的光线是衡量家庭收入的一个很好的指标——更多的光线意味着该地区的家庭更加富有。
The AidData researchers measured changes over time, starting back in 2000 and going up to 2013, in the amount of light visible within a certain distance from China's connective infrastructure. They found that in the later images, light was not just concentrated in the immediate vicinity of the projects, but it also had spread within the provinces and districts where they were built, as well as between provinces and districts. This, they say, suggests that Chinese connective infrastructure is spreading economic growth across large regions.
“援助数据”的研究人员考察了从2000年开始一直到2013年的变化,特别是在中国所建设的连接性基础设施一定范围内的可见光量随时间的变化。他们发现,在后期的图片中,可见光不仅集中在项目的邻近区域,而且也在项目所在的省份和地区,以及不同省份和地区之间传播。他们表示,这表明中国的连接性基础设施正在将经济增长扩展到更大的区域内。
Some researchers, though, say there's more digging to be done.
不过,一些研究人员说,还有更多的研究工作要做。
Parks agrees that their measures of light "could also capture other aspects of human development, including local health and education outcomes." But, he says, even if it does include other factors, finding a relationship between connective infrastructure and those results – including reduced inequality – is "still good news."
帕克斯赞同他们的光线测量方法“也可以捕捉到人类发展的其他方面,包括当地的健康和教育成果”。但是,他认为,即使包含了其他因素,发现连接性基础设施和这些结果之间的关系——包括减少不平等——仍然是一个“好消息”。
版权声明
我们致力于传递世界各地老百姓最真实、最直接、最详尽的对中国的看法
【版权与免责声明】如发现内容存在版权问题,烦请提供相关信息发邮件,
我们将及时沟通与处理。本站内容除非来源注明五毛网,否则均为网友转载,涉及言论、版权与本站无关。
本文仅代表作者观点,不代表本站立场。
本文来自网络,如有侵权及时联系本网站。
图文文章RECOMMEND
热门文章HOT NEWS
-
1
Why do most people who have a positive view of China have been to ...
- 2
- 3
- 4
- 5
- 6
- 7
- 8
- 9
- 10
推荐文章HOT NEWS
-
1
Why do most people who have a positive view of China have been to ...
- 2
- 3
- 4
- 5
- 6
- 7
- 8
- 9
- 10
